Title here
Summary here
View our interactive Python notebook at Kaggle here.
For this method, we performed bagging on 15 YOLOv8 models. Our goal is to see whether ensemble methods would be able to improve the performance of YOLOv8. Bagging was chosen as it is computationally faster than boosting or stacking, and because more models might be able to capitalize on the information gained from specific subsets of training data.
We again used the YOLOv8 pretrained model that we used in the previous method.
We performed the exact same data preprocessing with the single YOLOv8 method.
For each model, we bootstrapped a total of 4410 data points, which is equal to the original size of our training dataset. This amount is sampled with replacement from our augmented training data. The validation and testing datasets are unchanged.
Each model is then trained separately with the same parameters (50 epochs, image size 640).
To perform a prediction, we first gather the inference results from all models. To aggregate this result, we used a connected component-based approach as follows.
Find the connected components of the bounding boxes of all the models. Two boxes belong to the same connected component if their Intersection over Union (IoU) value is greater than a threshold. We foudn that a threshold of 0.2 works best for this case.
For each connected component, select the bounding box which comes from the model with the highest confidence involved in the connected component.
We evaluated our model on the test dataset. The results are as follows.
| Mean Average Precision (mAP) | |
|---|---|
| mAP | 0.79834 |
| mAP50 | 0.94405 |
| mAP75 | 0.90107 |
| Small bounding boxes | 0.56942 |
| Medium bounding boxes | 0.80427 |
| Large bounding boxes | 0.83717 |
| Mean Average Recall (mAR) | |
|---|---|
| mAR1 | 0.80506 |
| mAR10 | 0.82585 |
| mAR100 | 0.82585 |
| Small bounding boxes | 0.58611 |
| Medium bounding boxes | 0.81485 |
| Large bounding boxes | 0.85541 |
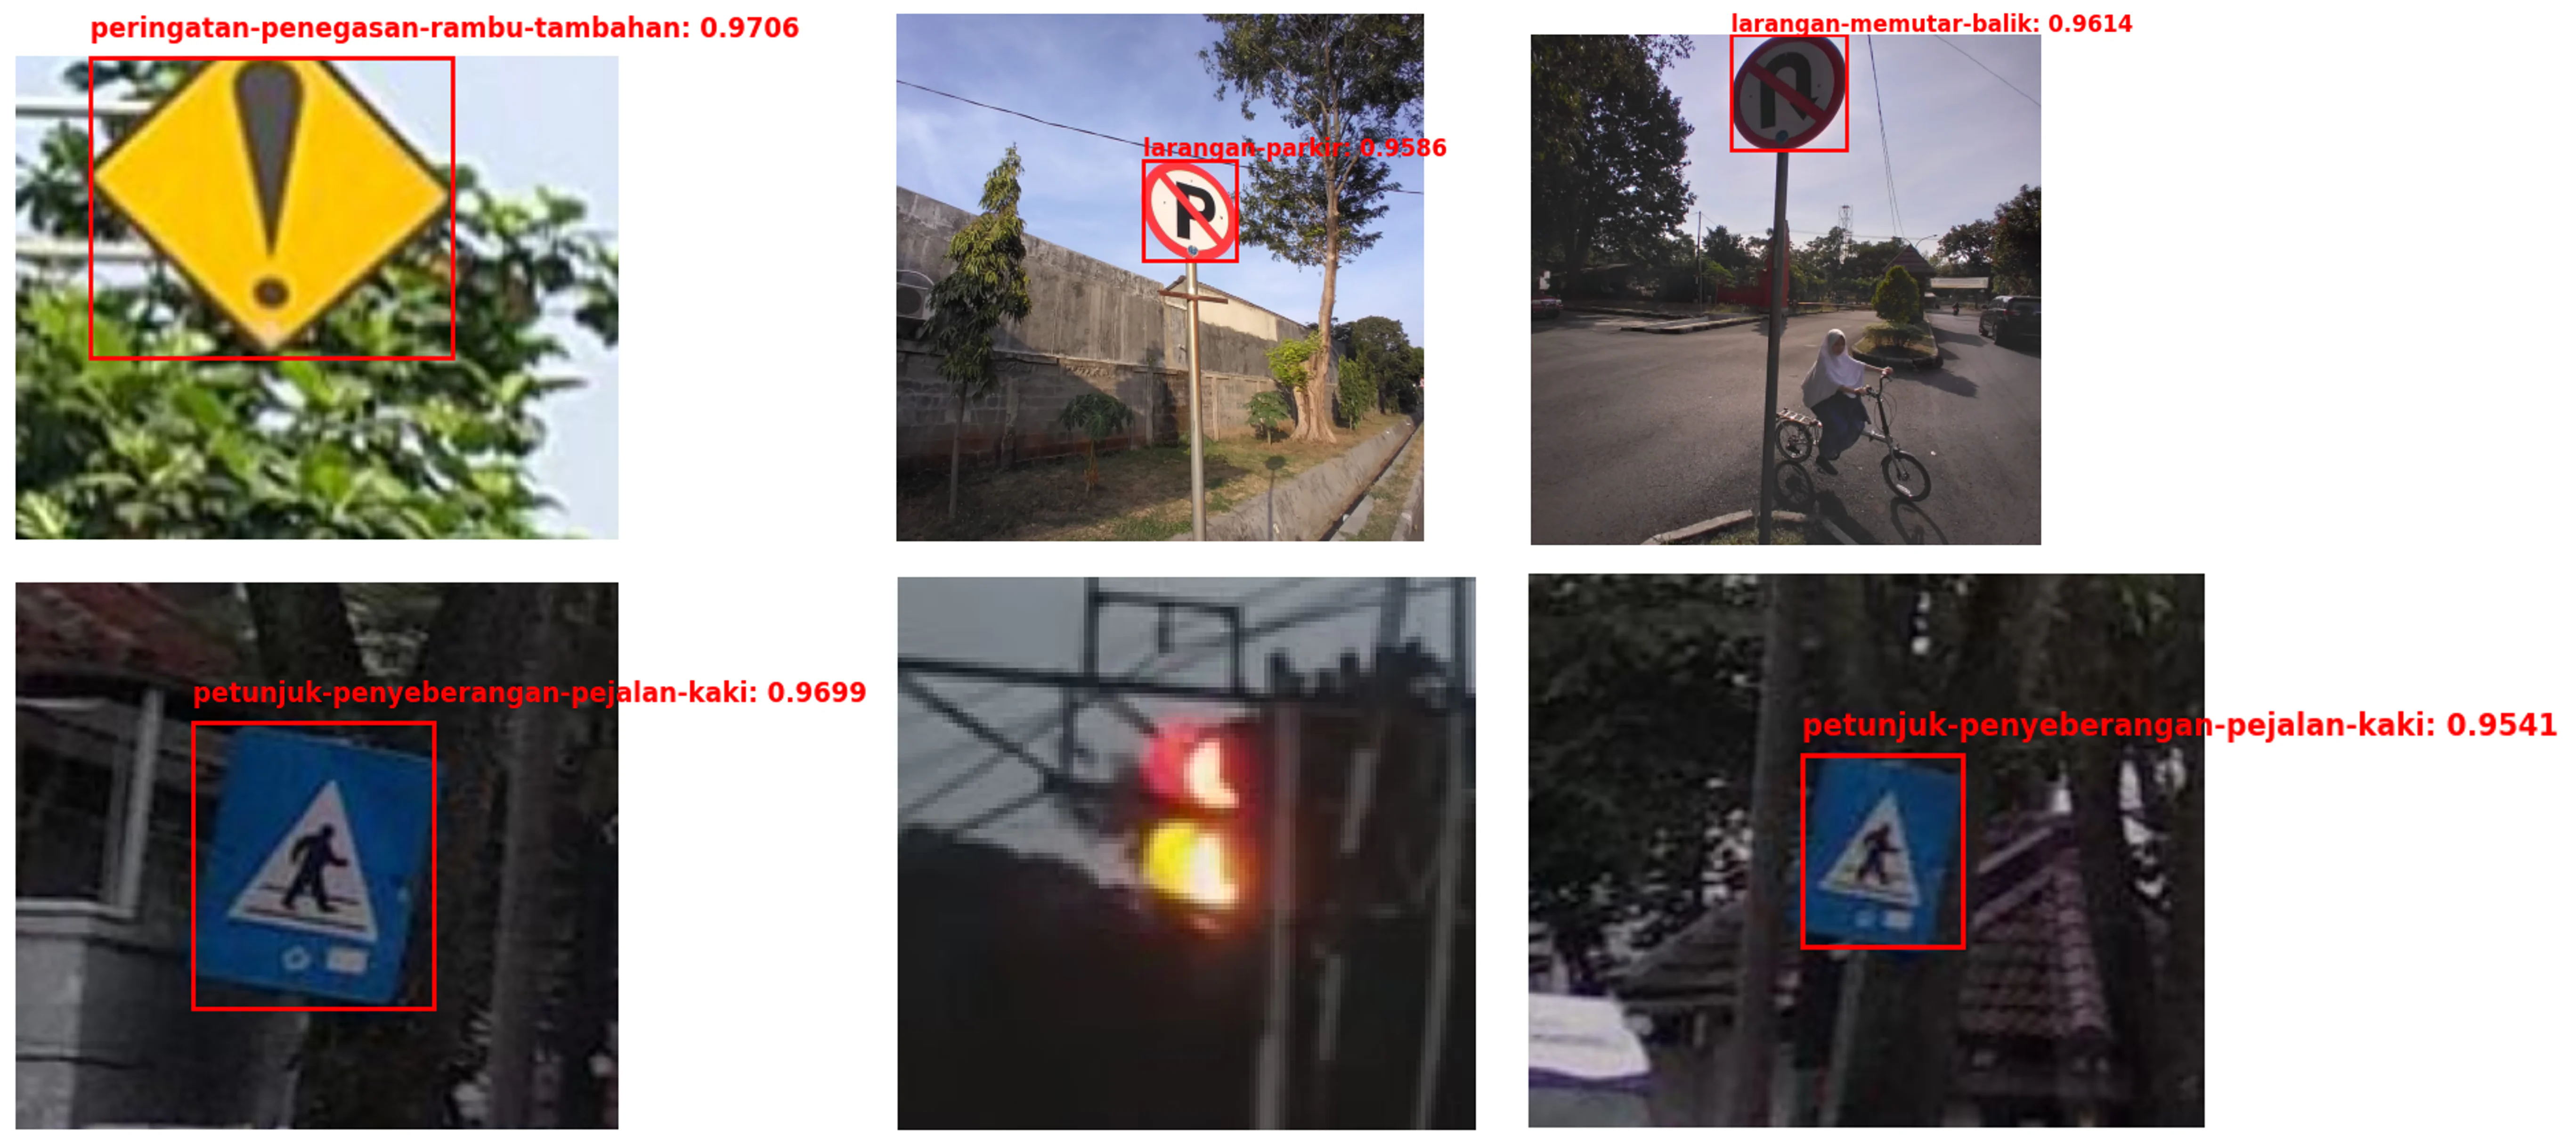
Some sample predictions made by the model are as follows. The predictions below includes one case where the model failed to predict an object.
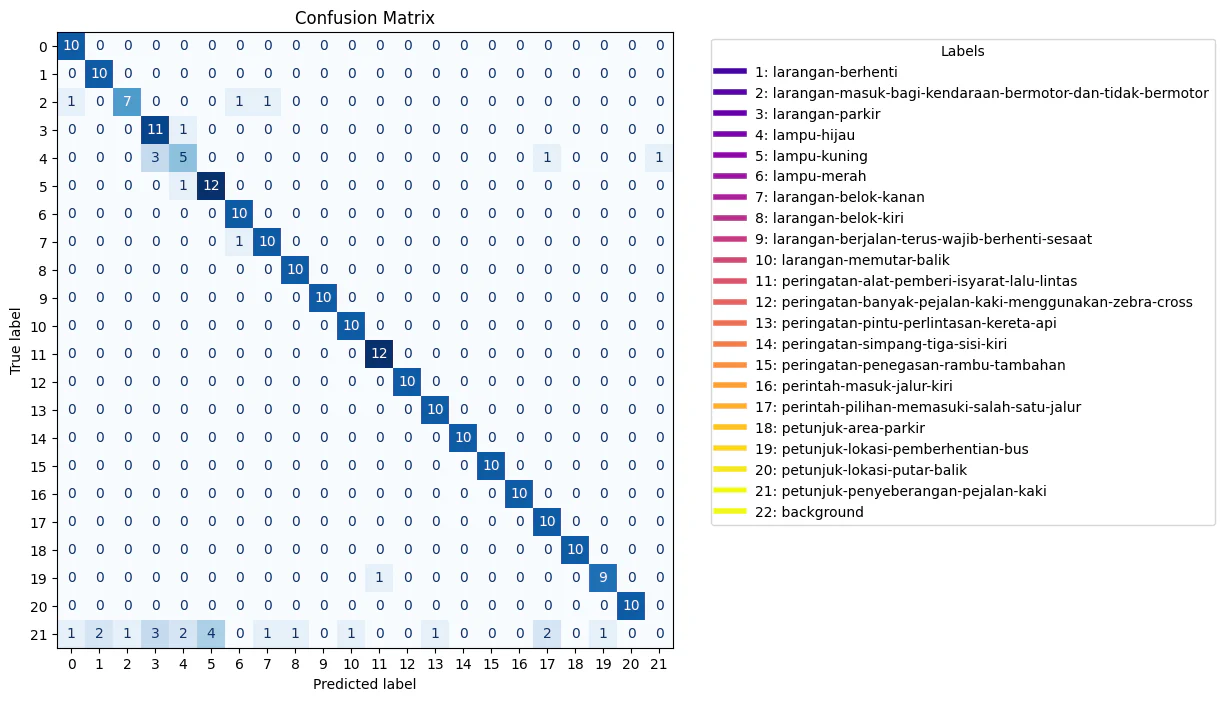
The confusion matrix is as follows.
While the ensemble still performed really well with an mAP50 of 94.405%, it is still worse than the single model whose mAP is around 3% higher. We conjecture that the cause is a larger number of false positives that appear during aggregation of the inference results.